diaGrabber -> read, process, plot, automate
diaGrabber is a module fully written in Python. Its main benefits are:
- no restriction to 2- or 3-dimensional problems
- handle unstructured data
- no limitation of the size of source-files
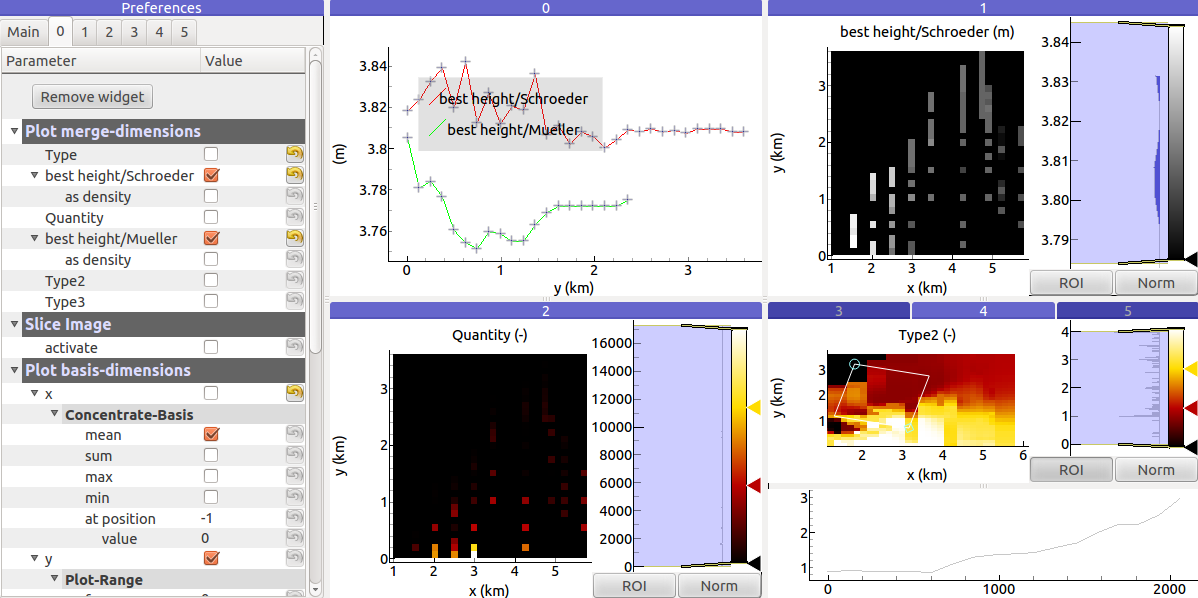
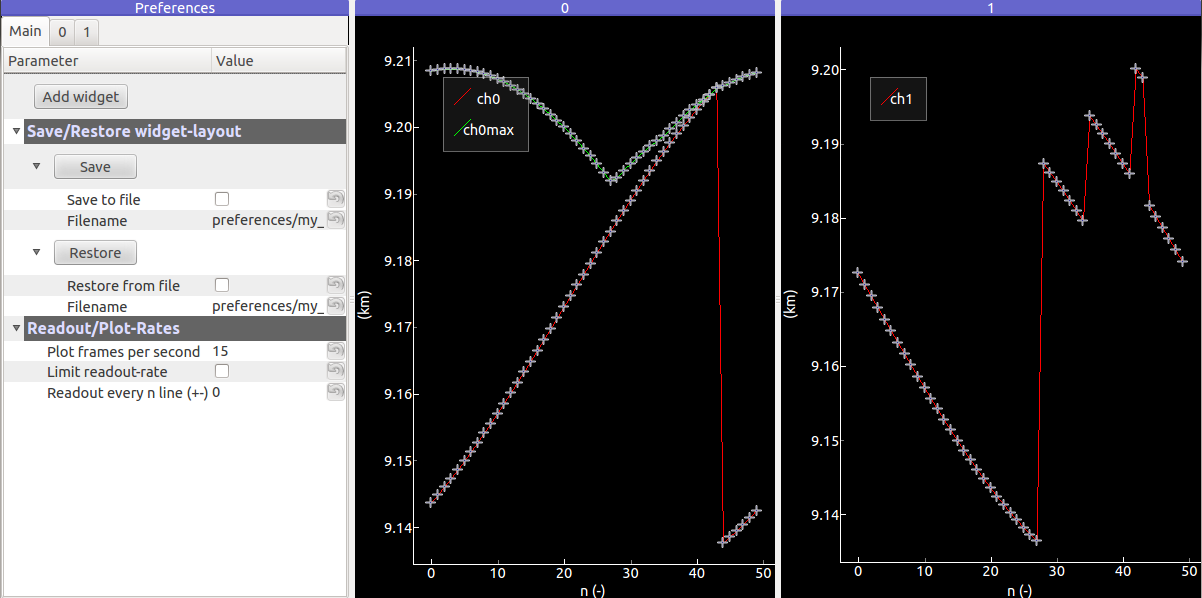
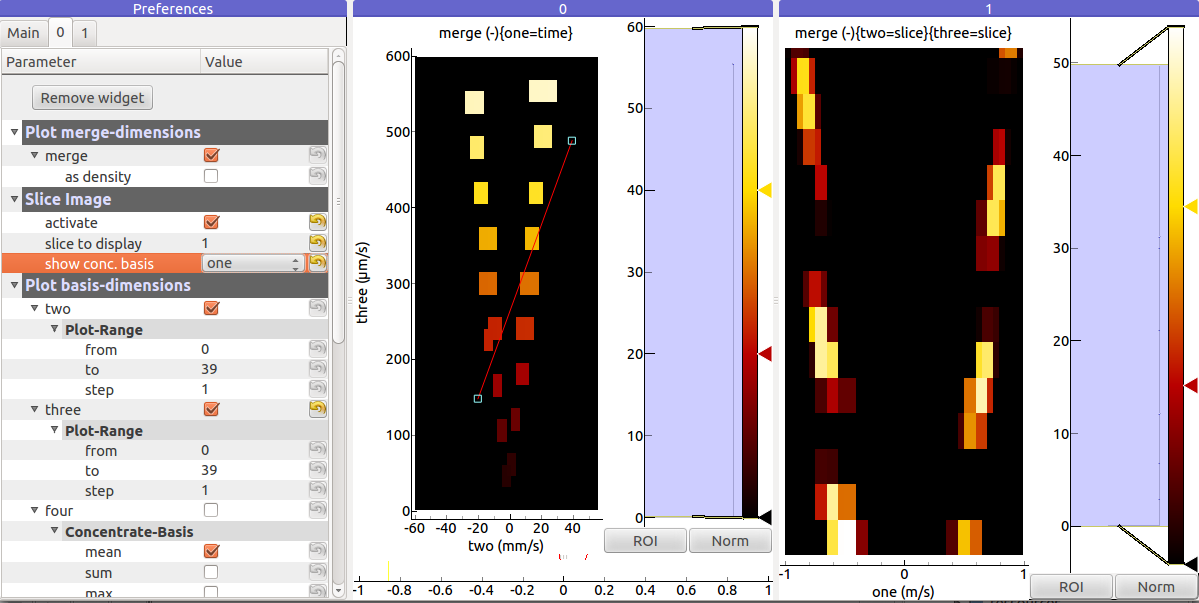
- interactive visualization of the readout of sources
- compair and connect multiple source-files (also of different file-types like plainText or libreOfficeCalc)
- fully automatable
- powerfull options to manipulate and filter values
- inter-/extrapolate between given points
Requirements
Python v2.7 (the programming lanuage itself)
ooolib (to read from open-/libreOffice-calc)
numpy/scipy (Python modules for numeric and scientific problems)
bottleneck (superfast NaN-array-handling)
Installation
- download and install all required modules.
- download diaGrabber, go to its main-directory and type in a termial:
... in Linux:
sudo python setup.py install
... in Windows
Start -> Run -> ‘cmd’
go to you download-directory and type:
python setup.py install
If windows doesn’t know the commend ‘python’, try this.
Use the functions of diaGrabber via:
import diaGrabber
in a Python script or shell. See the Examples to get an idea of it.